Using MLOps to Forecast Household Energy Consumption & Generation
Links
Why Energy Data
Tech Stack



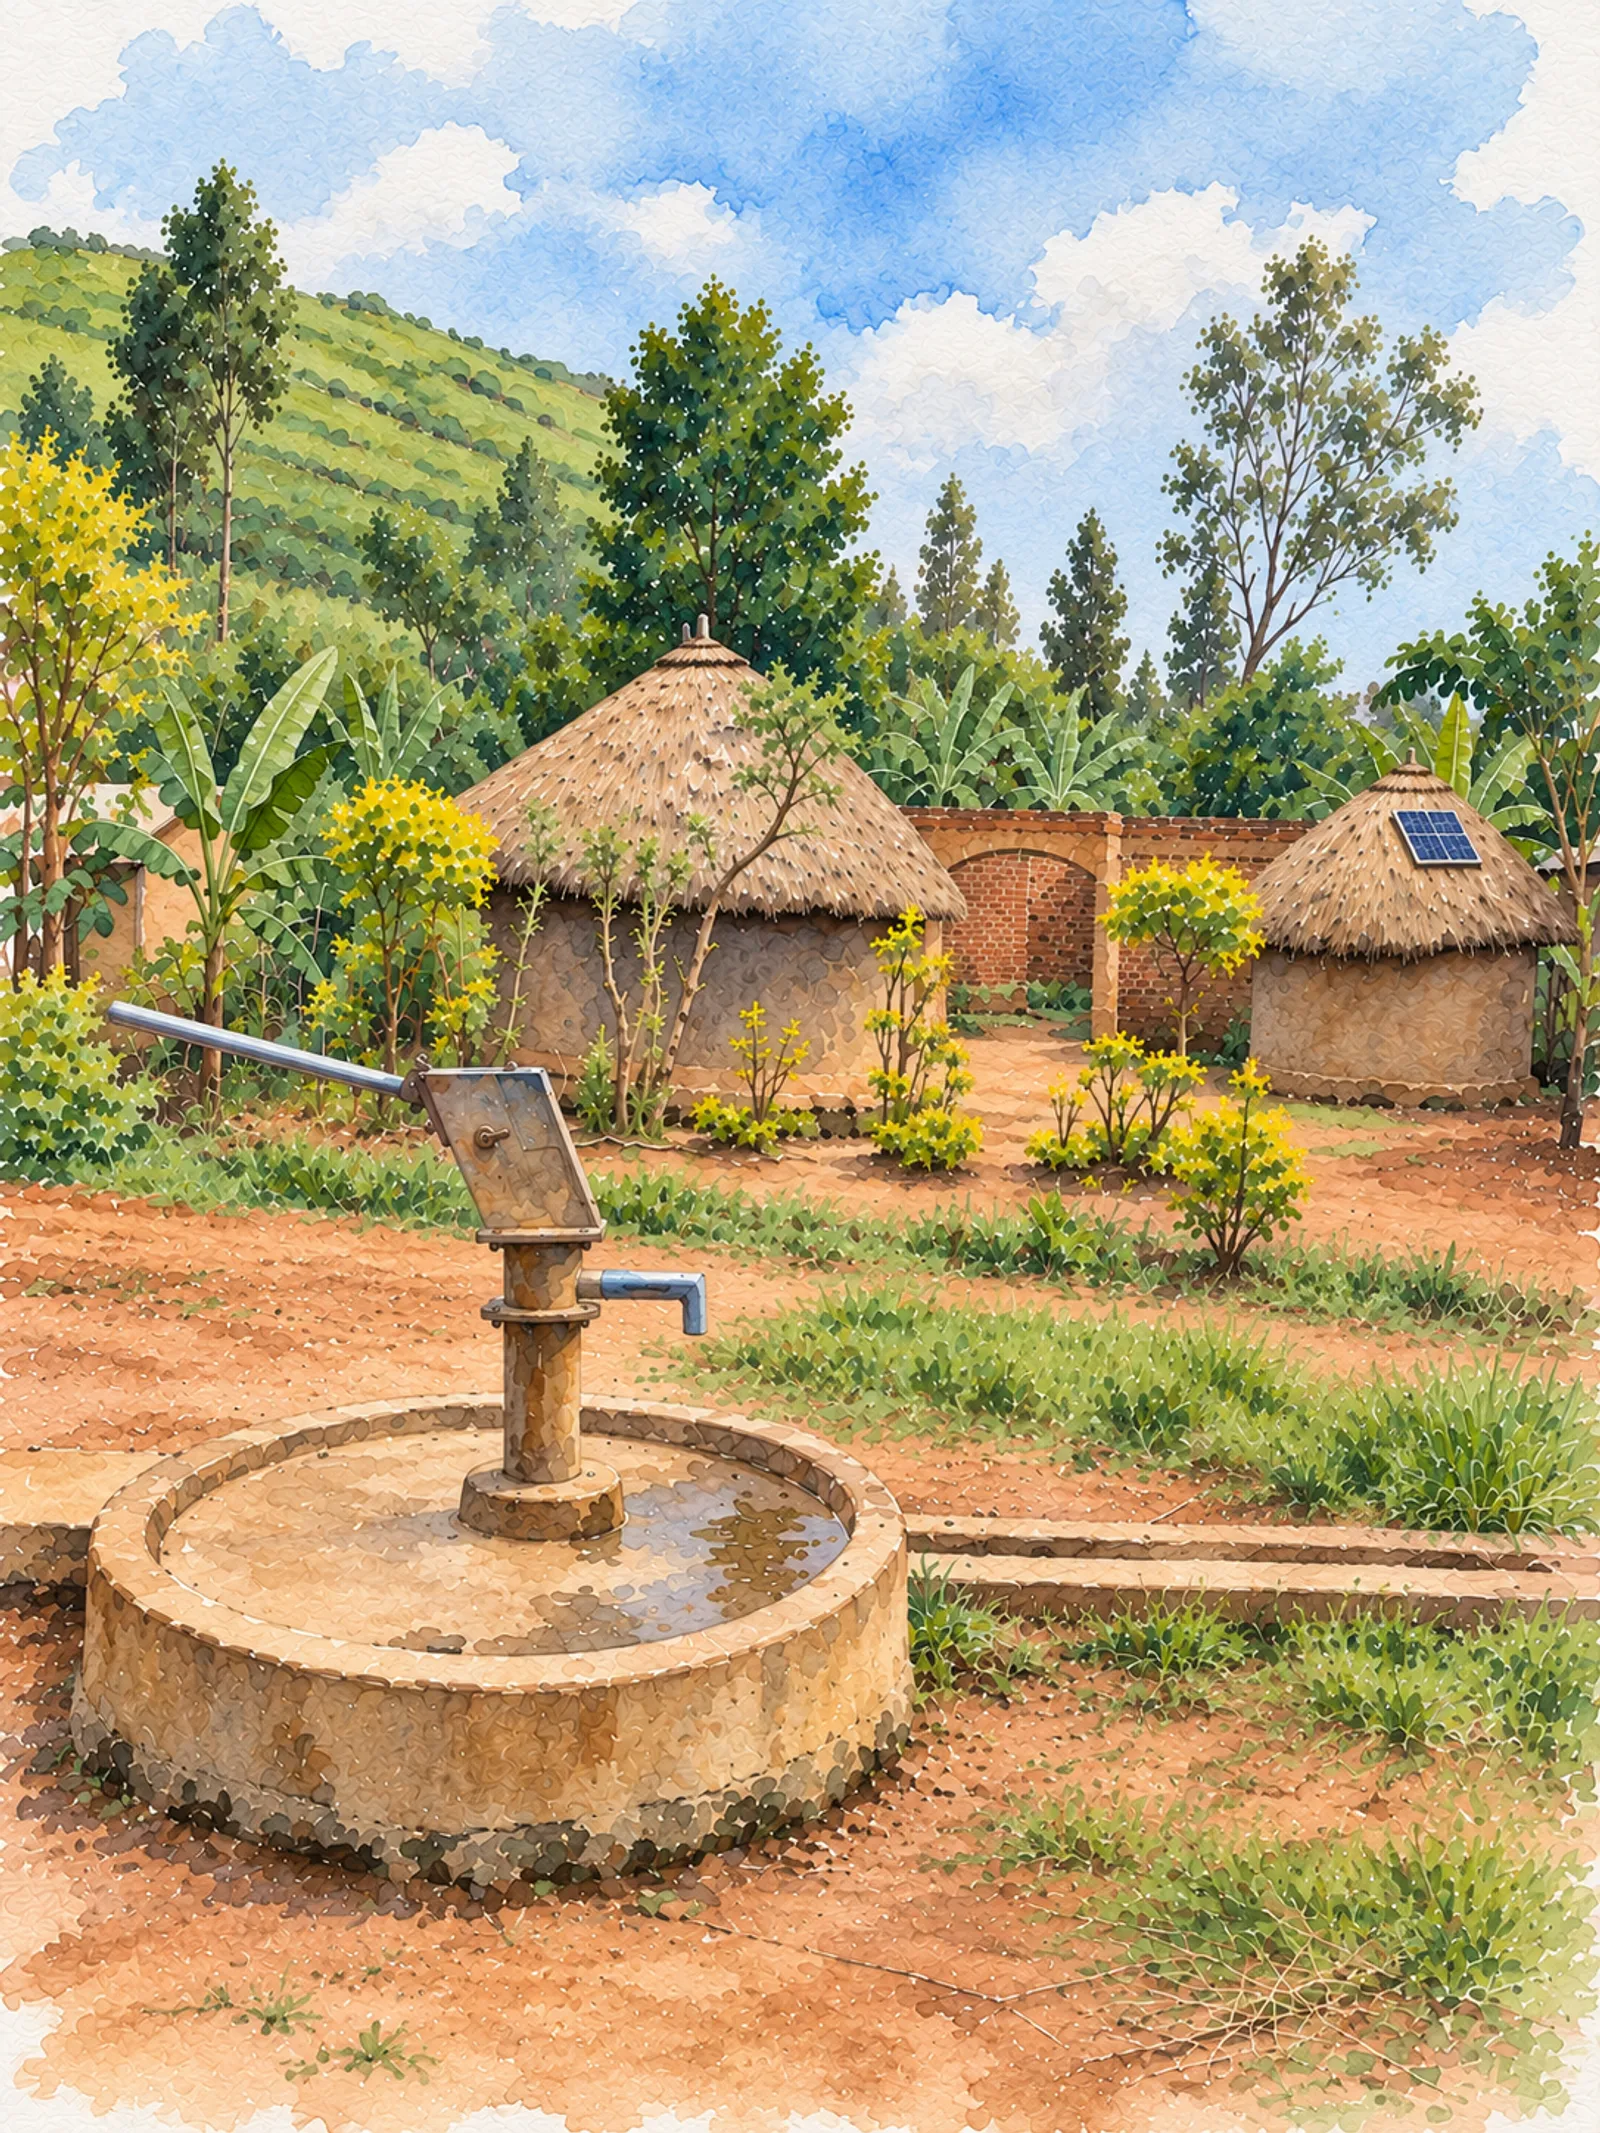
During my first year in Zambia with the Peace Corps, I lived with essentially no electricity at all. A few times a week I'd ride a bike into the boma just to charge my phone, or charge it off a little solar light that was provided to us. In my second year, I enlisted the help of some boys living in my village to physically climb up onto my thatch roof and place a solar panel I'd bought in town. I wired it up to an inverter and a car battery inside my hut, and used that setup for the rest of my time there.
That was really my first experience living solely on a renewable resource, and it proved to be more than a little addicting. Especially compared to now, when I have a Duke Energy bill that comes every month and has begun to feel like a subscription service that will only stop when I die.
In Zambia I kind of relished the opportunity to check my battery levels and keep track of the weather, trying to figure out how much power I'd have to work with and making decisions based on that. I felt a little bit more grounded in what activities I did and when, and how much electricity they consumed. That habit never really went away. These days I'm working with slightly more sophisticated tools. I installed the Emporia Vue 3, a whole-home energy monitor, and use the Ecobee smart thermostat, and a handful of 433 MHz temperature and humidity sensors scattered around the house. I've spent hours building out Home Assistant dashboards with Claude to show energy usage and optimize our house.
The task of attempting to build out a machine learning model to predict and understand household energy consumption and solar generation fits squarely in my wheelhouse, and it's a good excuse to get more comfortable with Snowflake, spec-driven AI use, and a number of other tools along the way.
Everything I've done here is public, including the code and the dataset of household electricity usage.
The Tech Stack
GitHub's spec-kit: I've used spec-driven development before. I use OpenSpec at work and spec-kit on personal projects, and it's become my default way of working with an AI coding agent. Each stage starts with a written spec and plan that you work through before implementing anything else. It's a bit slower up front, but it's proven to keep the reasoning visible and the direction aligned.
Snowflake: the system of record for raw and processed data. I'd never worked with it hands-on before this project, but have worked with somewhat similar tools in GCP.
The Ausgrid Solar Home Electricity dataset, collected by Ausgrid, the local electricity distributor. This dataset contains a pretty rich record:
- electricity consumption and PV production
- of 300 customers (in Sydney and its area)
- over three years (July 2010 to June 2013)
- with a 30-minute timestep
It's a peer-reviewed research dataset (Ratnam et al.), used in multiple published grid-integration studies. I felt like it would be as good as anywhere to start.
Each customer's readings are split into three categories: GC (general consumption), CL (controlled load, things like off-peak hot water), and GG (gross solar generation, everything the panels produced, not just what wasn't self-consumed). GC + CL together is a household's total consumption; GG is total generation. Here's what that looks like across one real day for the household I use:
One Household's Consumption vs. Controlled Load vs. Solar Generation
- GC General Consumption
- Electricity drawn from the grid for everything on the home's normal tariff: lights, appliances, electronics, ordinary day-to-day use. Excludes anything metered separately as controlled load or offset by solar.For this household, general use running throughout the day, independent of daylight.
- CL Controlled Load
- Electricity for appliances on a separate off-peak circuit and tariff, typically electric hot water systems or pool pumps, that the utility can switch on during set low-demand hours (usually overnight).For this household, the off-peak hot water heater, firing overnight and once again mid-morning.
- GG Gross Generation
- The solar panels' total output, measured by its own meter before any of it is used by the household. "Gross" because it's everything produced, not just the portion left over after the home's own consumption.For this household, a clean solar curve: zero overnight, peaking around midday.
For this use case, I decided to model across the full panel of all 300 households rather than picking one representative case. That means treating each household's panel capacity, postcode, and coverage quality as inputs.
Here's a small taste of that variation: solar generation for 3 randomly chosen households over the same 3 days.
Solar Generation Across 3 Randomly Chosen Households
The full dataset, licensed CC BY 3.0 Australia, is available here.
Open-Meteo: I wanted to make sure I brought in historical temperature and solar radiation data for training if available, and, also if possible, a live forecast at prediction time, since heating/cooling load and cloud cover are apparently the biggest swing factors in day-to-day energy use. I've used Open-Meteo before and it covers both historical and forecast data and is publicly available.
Generation per kWp vs. Solar Radiation, by System Size
Try It: Interactive Forecast Dashboard
Both models (LightGBM, trained on lag/rolling/calendar/weather features) export to ONNX and run entirely client-side in the browser, no server, no account, nothing you enter leaves your device. Adjust recent usage, date, forecast temperature, and solar radiation, and watch predicted consumption and generation update live. Inputs outside what the model actually trained on are flagged as extrapolation rather than shown with false confidence.
Status
Both models are trained and validated against three years of real Ausgrid data: the consumption model beats its naive "tomorrow = today" baseline (3.976 kWh MAE vs. 4.533 kWh), and the generation model beats its baseline by a wider margin (1.433 kWh vs. 3.036 kWh), which tracks with how strongly solar output follows weather and season. The full pipeline, ingestion, aggregation, weather, training, forecasting, and the dashboard export, runs end-to-end against a live Snowflake account. Next up: scheduling it to run automatically on GitHub Actions. Follow along or check the full source on GitHub.